Using a reporting tool is one of the simplest ways for enterprise companies to manage massive amounts of data. These tools let you visualize data, make it simple to read complex data, and save time.
But how can you be sure you’re choosing the best course of action for your company? In this article, you will discover everything there is to know about reporting tools and find the ten best free online reporting tools in 2023. Keep reading.
Keep reading!

Table of contents
What are Reporting Tools?
Reporting tools are software applications that collect, process, and analyze data and present the results in a format that is easy to understand and use. The data can come from various sources, such as databases, spreadsheets, or online platforms.
The goal of a reporting tool is to provide insights into the data, allowing users to make informed decisions based on the results.
There are many types of reporting tools, including:
- Business Intelligence (BI) reporting tools: These tools provide advanced data analysis and visualization capabilities for organizations, allowing them to make data-driven decisions.
- Financial reporting tools: These tools provide financial data and analysis, such as balance sheets, income statements, and cash flow statements.
- Project management reporting tools: These tools provide project managers with real-time updates on project progress, budgets, and schedules.
- Marketing reporting tools: These tools provide marketing teams with insights into the performance of their campaigns, such as website traffic, audience demographics, and conversion rates.
- Website analytics reporting tools: These tools provide website owners with insights into their website’s traffic, audience, and user behavior, allowing them to make informed decisions about their website.
Read this article: Chrome Password Manager Vs. Lastpass 2023: Uses, Pros & Cons.
Why Should You Use A Free Online Reporting Tool?
Using a free online reporting tool can help you:
Monitor website performance
It can help you track key metrics, such as page views, unique visitors, and bounce rates, so you can see how your website performs over time.
Understand your audience
You can gain insights into your audience demographics, location, and interests, which can help you tailor your content to meet their needs better.
Check out this content: Technical Program Manager Vs. Product Manager: Differences & Similarities.
Make data-driven decisions
You can use the data a reporting tool provides to make informed decisions about your website, such as which pages to optimize or which marketing campaigns to run.
Save time
An online reporting tool allows you to easily access your website data from anywhere, saving you time compared to manual data collection and analysis.
Cost-effective
Free online reporting tools like Google Analytics provide a cost-effective way to gain valuable insights into your website’s performance and audience without additional software or hardware.
Read also: What Is Samsung One UI Home?
Are Free Online Reporting Tools Worth It?
Free online reporting tools like Google Analytics can be worth it. They offer many benefits, such as providing valuable insights into your website’s performance and audience, saving time compared to manual data collection and analysis, and being cost-effective.
However, it’s essential to remember that free online reporting tools may have limitations regarding the data they collect and the level of customization they offer. Consider using a paid reporting tool if you need more advanced features or order more detailed data.
A free online reporting tool is an excellent choice if you are starting and need a basic understanding of your website’s performance and audience. And if you need more advanced features or more detailed data, you can upgrade to a paid tool later.
See also: How To Download All Photos From Samsung Cloud.
Who Can Use a Free Online Reporting Tool?
Anyone who has a website or runs an online business can use a free online reporting tool. This includes individuals, small businesses, non-profits, and large corporations. Free online reporting tools like Google Analytics provide a cost-effective way to gain insights into your website’s traffic, audience, and user behavior, regardless of the size or type of your organization.
To use a free online reporting tool, you must create an account and install a tracking code on your website. The tool will start collecting data you can access through your account dashboard.
Check out: What Is Single Take On Samsung?
How Can I Start Using A Reporting Tool?
Here are the steps to start using a reporting tool:
Identify your needs
Determine what data you need to collect and what insights you want to gain from the data. This will help you choose the right reporting tool for your needs.
Choose a reporting tool.
Research the different reporting tools available, and compare their features and pricing to find the best one for your needs.
Sign up for an account.
Most reporting tools require you to create an account to use their service.
Connect your data sources.
Depending on the reporting tool you choose, you may need to connect it to your data sources, such as a database, spreadsheet, or online platform.
Read also: How To Wear Samsung Earbuds.
Configure your reports
Configure the reports you want to create, such as dashboards, charts, or tables, to display the data you want to see.
Collect data
Once you have configured your reports, the reporting tool will start collecting data and providing you with insights.
Analyze the data
Review the results of your reports and use the insights to make informed decisions.
Schedule reports
If necessary, schedule your reports to run automatically so that you can receive regular updates on your data.
It’s essential to keep in mind that the specific steps to start using a reporting tool may vary depending on the device you choose. Be sure to read the documentation and follow the instructions provided by the tool’s vendor.
See also: How To Check Screen Time On Samsung.
10 Best Free Online Reporting Tools In 2023
#1. JasperReports
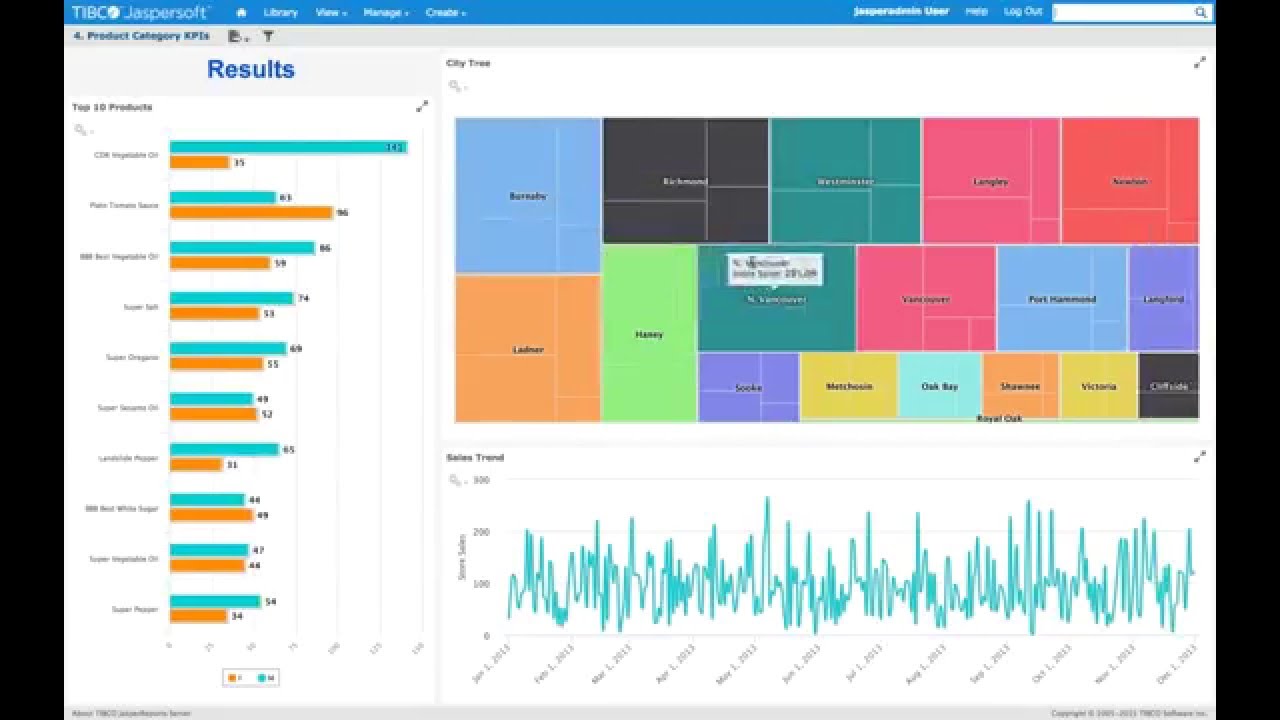
One of the most well-known data analytics services is Jaspersoft ETL. This service was created in Java and is GPLv2-licensed. It can export data in several formats, including HTML, PDF, XML, and CSV. Finally, JasperReports works with a variety of databases.
See also: What Is Samsung Capture?
#2. FineReport
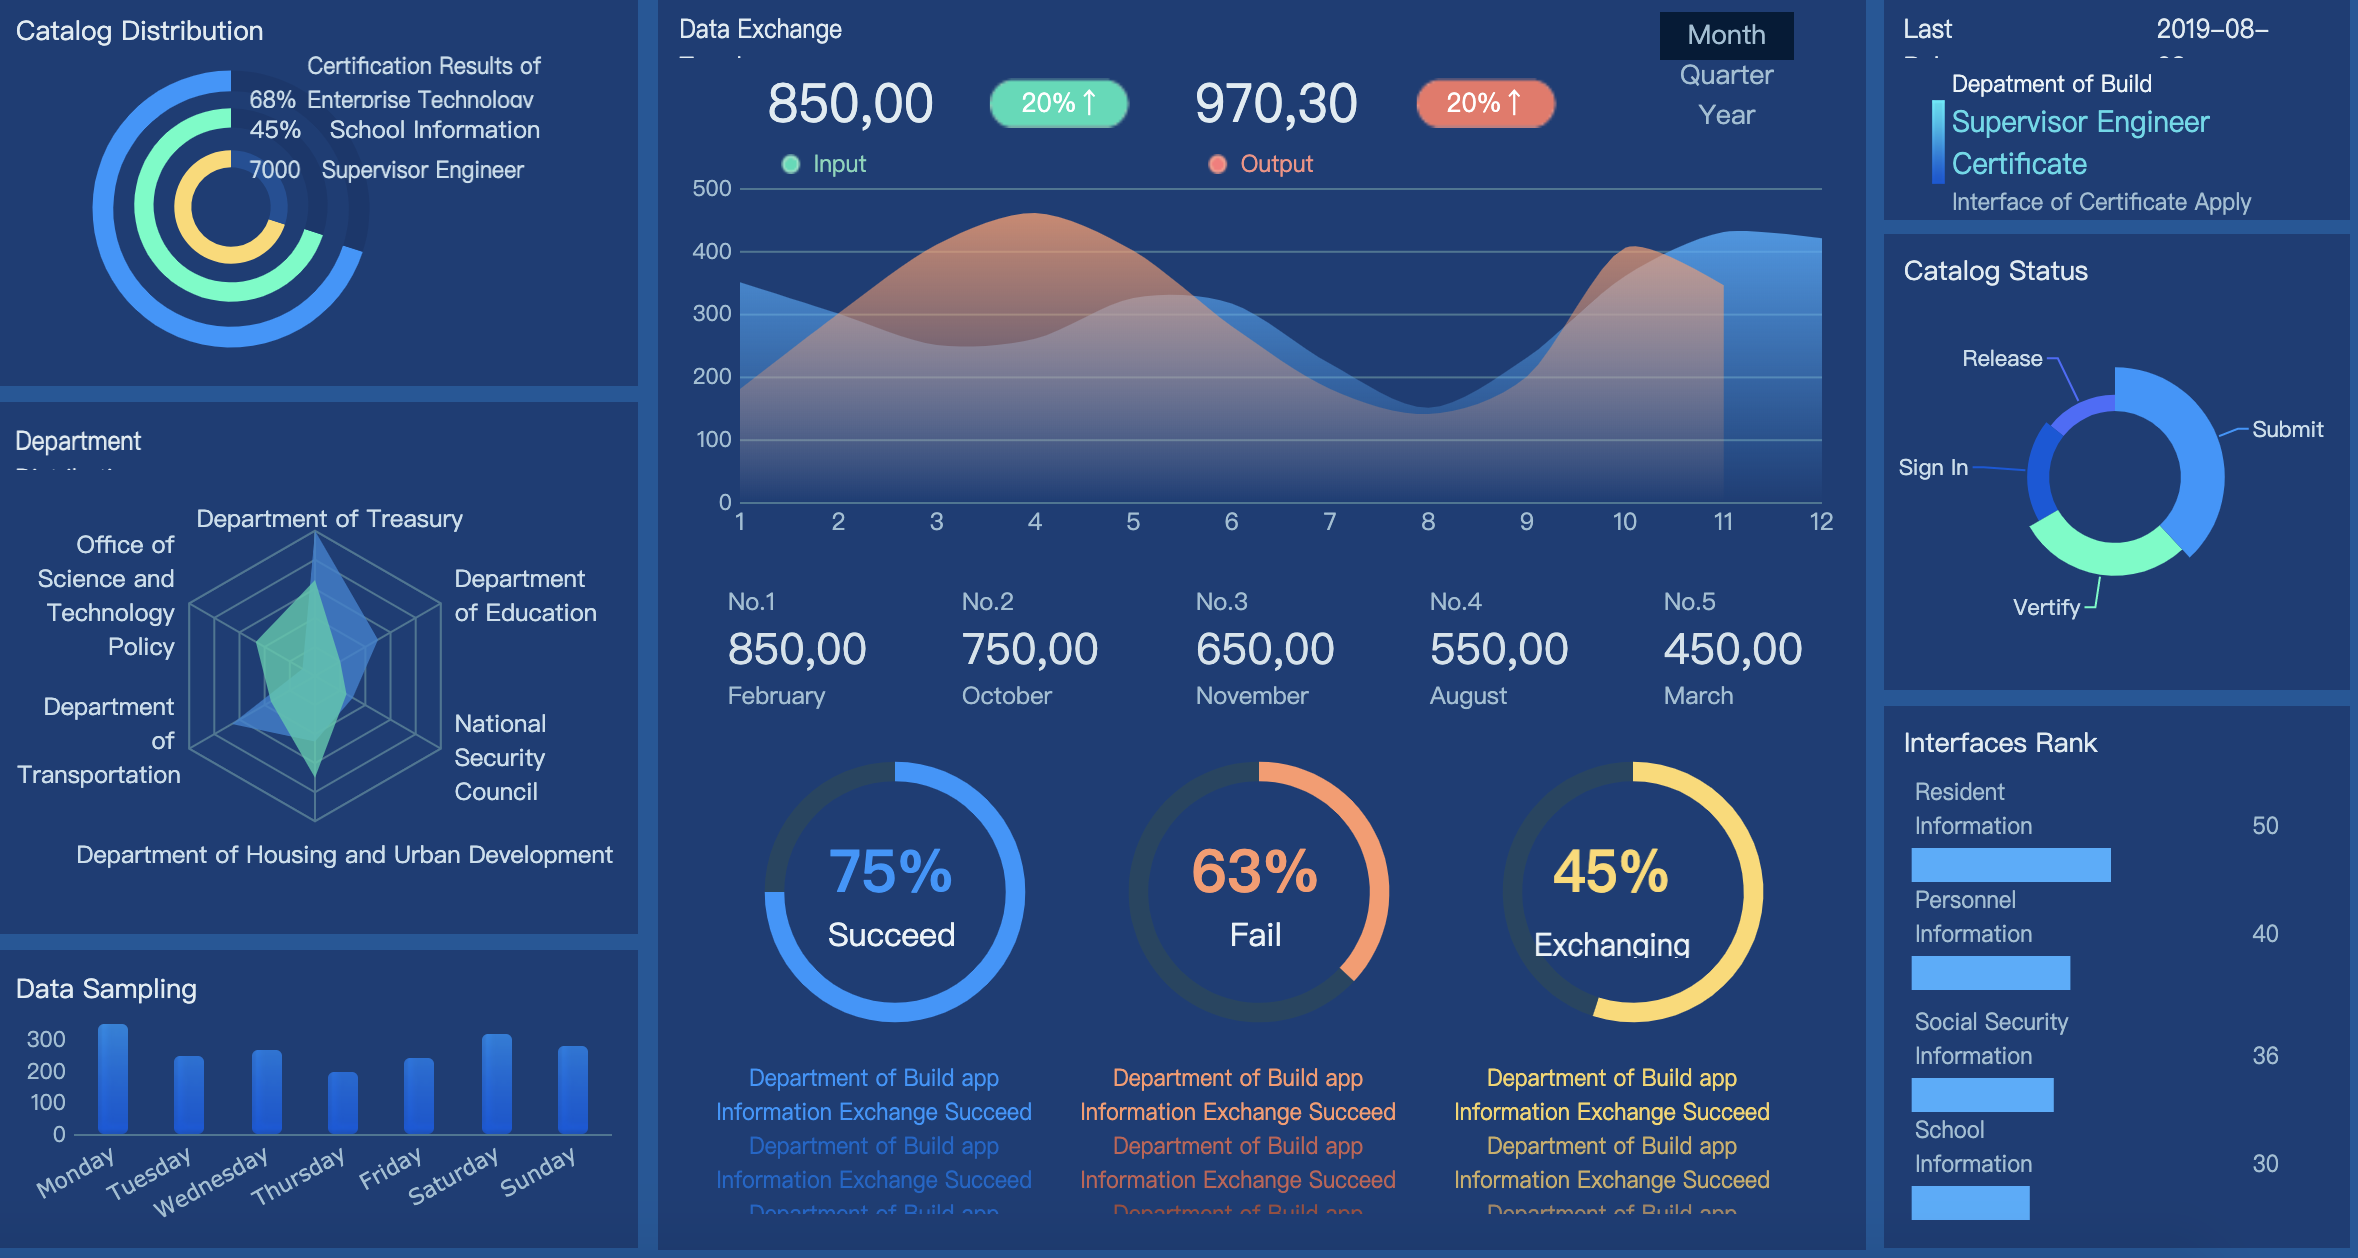
One of its main advantages is the freedom to use FineReport without regard to time or function restrictions.
You’ll soon notice that this tool’s user interface looks like Microsoft Excel. It enables you to generate data quickly, export it, or print complex, atypical reports. Two more features that FineReport shares with the reporting tools in Microsoft Excel are the ability to import data in groups or guarantee convenience when creating reports.
Due to its data entry features, FineReport software stands out from the competition. The web reports established by FineReport enable the user to write data back to the source.
Finally, this tool is simple, thanks to various open APIs. Other devices, on the other hand, frequently need to be integrated with numerous other systems.
Check out this content: Why Won’t My Samsung TV Turn On?
#3. JFreeChart
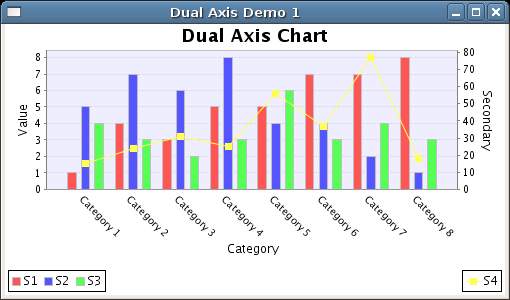
Java-based reporting software called JFreeChart is available. With the help of this tool, you can create mixed graphs and dashboards as well as pie, bar, line, Gantt, and area charts. These files can get exported using the tool in JPEG or PNG formats.
One of the most reliable and compact reporting tools is JFreeChart. Additionally, it supports various chart formats. Its adaptable design makes it simple to use in client-side and server-side applications.
Last but not least, this tool supports various exporting formats, including JavaFX components, Swing components, vector graphics, file formats, and image formats.
Read also: How To Use Wireless Charger Samsung
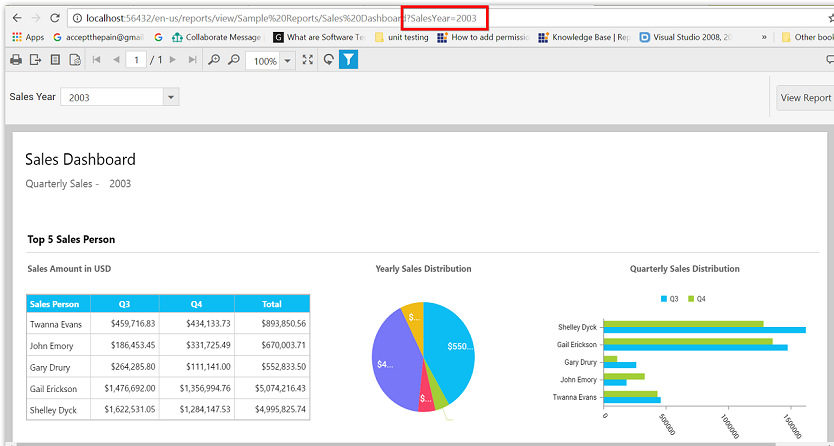
#4. iReport

For JasperReports Server and JasperReports Library, iReport is a design service. Using this system, you can create complex documents, including subreports, images, charts, and cross-tables. You can also convert the document into a variety of file formats.
See also: How To Watch Youtube On Samsung Smart Tv.
#5. Pentaho

Pentaho is a free toolkit that offers a variety of functionalities, including a reporting designer, reporting engine, and reporting SDK. The ASL or Apache Software License governs the licensing of the Pentaho Community Edition.
The following file formats can be created using this tool: PDF, Excel, HTML, rich text, text, CSV, and XML. Additionally, the sourced files can convert data from various sources to readable form.
Check out this content: How Do I Stop Pop-Up Ads On My Samsung?
#6. BIRT

A data reporting tool built on Eclipse is called BIRT. It enables the creation of reports and their later integration into clients or web applications.
BIRT functionalities have two categories: a visual designer and runtime features. With the first, you can create any BORT design, while with the second, you can use it in any JAVA environment.
You can sync the additional diagram engine feature of BIRT with any BIRT diagrams. Finally, XML files are for saving the design templates. Several databases, including SQL databases, jfire script objects, JDO data store, POJOs, Web services, and XML, are also accessible.
See also: How To Connect Wireless Headphones To Samsung Tv.
#7. Seal Report

A data reporting tool for the Microsoft.NET framework, Seal Report, was created entirely in C#. It provides a comprehensive framework enabling you to build dashboards and regularly reports data from any database. This tool’s primary purpose is to simplify the installation and dashboard designs.
The following are some of Seal Report’s primary features:
- Dynamic SQL database. Users can query the data system using SQL or the dynamic SQL of the Seal engine.
- Regional pivot points. Users can display it in pivot tables and dashboards by dragging and dropping the element. Also, HTML5 charts are supported.
Read also: What Is Samsung Email?
#8. Open Reports
Another web-based data reporting tool is Open Reports. Users can use a web browser to preview dynamically generated files in HTML, PDF, or XLS formats. Java was used to create this piece of software.
To ensure to meet the various needs, Open Reports supports a variety of data reporting engines, including JFreeReport, Eclipse BIRT, JasperReports, and JXLS.
See also: How To Find IMEI On Samsung
#9. Easy Report
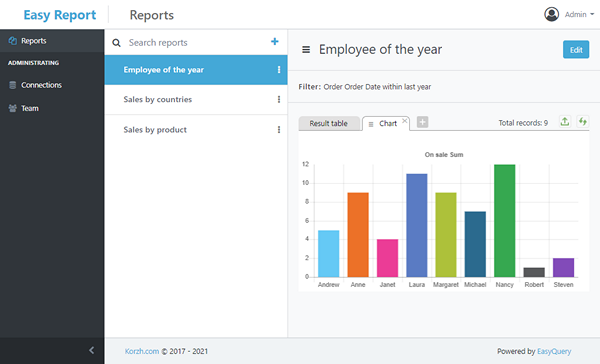
A C# plug-in for Microsoft Excel is called EasyReport. The system is simple to use, and one of its best features is its intuitive, user-friendly design.
This tool’s primary function is converting an SL statement’s row and column structures into HTML tables.
The attributes Colspan and RowSpan also have support from Easy Report. Users can export Excel reports, create fixed table headers, display charts, and perform left-column functions using the reporting tool.
Check out this content: How Much Is A Samsung Galaxy S8?
#10. SpagoBI
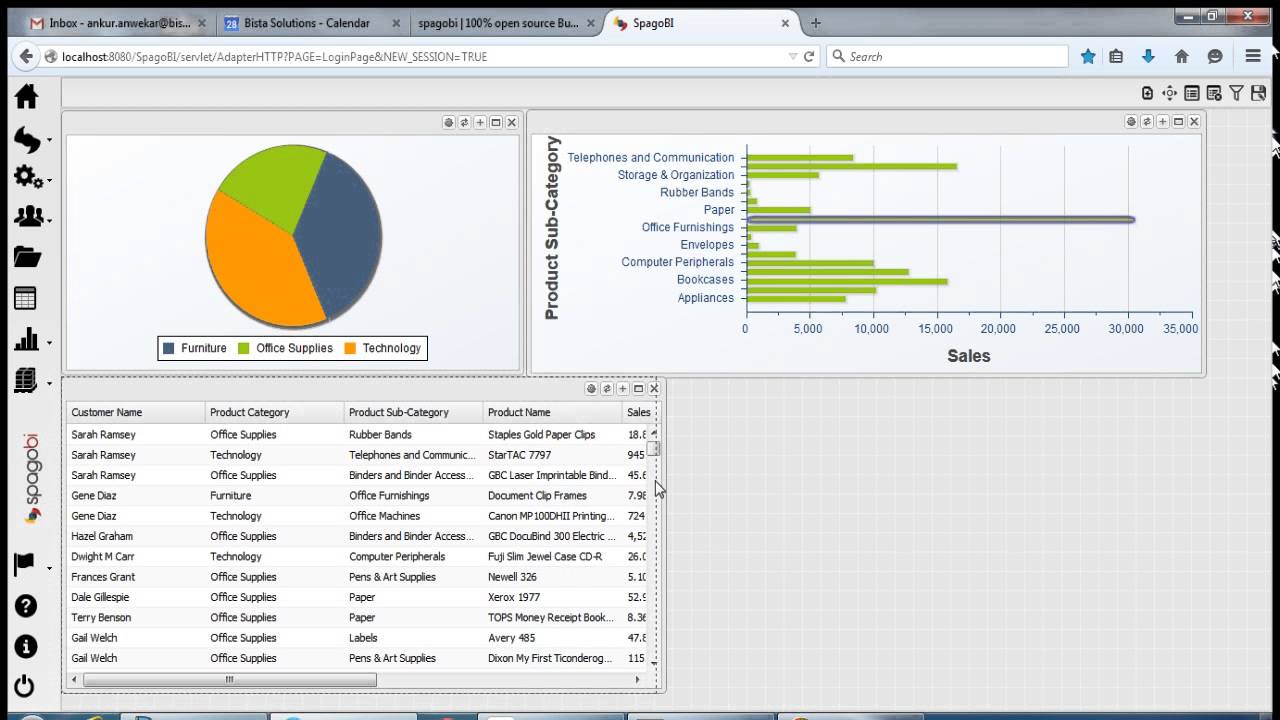
SpagoBI lab’s Engineering Group created and oversaw the 100% open-source SpagoBi software suite. This reporting tool offers data analytics features, including custom solutions like geo-location, social network, self-service, and what-if analytics. It also provides traditional reporting and charting capabilities.
The timing of task functions is another feature of this reporting tool. Additionally, it supports big data query engines like Hive. The client and authority management modules are part of the most recent adaptation.
See also: How To Connect Ipad To Samsung Tv
Frequently Asked Questions
A free online reporting tool is a web-based platform that gives website owners insights into their website’s traffic, audience, and user behavior. These tools typically offer free basic analytics features, such as page views, unique visitors, and bounce rates.
Anyone who has a website or runs an online business can use a free online reporting tool. This includes individuals, small businesses, non-profits, and large corporations.
To start using a free online reporting tool, you must create an account and install a tracking code on your website. The tool will start collecting data you can access through your account dashboard.
Free online reporting tools may have limitations regarding the data they collect and the level of customization they offer. If you need more advanced features or order more detailed data, you may consider using a paid reporting tool.
A free online reporting tool can help you monitor your website’s performance, understand your audience, make data-driven decisions, save time, and be cost-effective. These tools provide valuable insights into your website’s traffic, audience, and user behavior, allowing you to make informed decisions about your website.
Conclusion
Free online reporting tools like Google Analytics provide a cost-effective way for website owners to gain valuable insights into their website’s performance and audience.
These tools are easy to use, providing valuable data such as website traffic, audience demographics, and user behavior, which can help website owners make informed decisions about their websites.
Whether you are an individual, small business, non-profit, or large corporation, a free online reporting tool can help you better understand your website’s performance and audience, saving you time and resources compared to manual data collection and analysis.
Read also: When Did The Samsung A11 Come Out?
References
- https://www.selecthub.com
- https://whatagraph.com
- https://dzone.com/articles
- https://www.capterra.com
72 comments